
Table of Contents
1 Understanding Agile Metrics: A Comprehensive Guide
1.1 Introduction
In the fast-paced world of software development, Agile methodologies have revolutionized how teams approach project management. Agile emphasizes flexibility, collaboration, and customer-centricity, allowing teams to adapt quickly to change and deliver high-quality products. However, the effectiveness of Agile practices hinges significantly on the metrics employed to evaluate progress, performance, and productivity.
Agile metrics serve as a compass, guiding teams through the intricacies of iterative development. They provide valuable insights into the health of a project, help identify areas for improvement, and facilitate informed decision-making. This article delves into the various dimensions of Agile metrics, exploring their purpose, types, applications, and best practices for implementation.
1.2 The Importance of Agile Metrics
Agile metrics are quantitative measurements used to assess the performance and efficiency of Agile teams and processes. They facilitate transparency, enhance accountability, and support continuous improvement. Unlike traditional metrics, which often focus on outputs (like hours worked or lines of code), Agile metrics emphasize outcomes, such as customer satisfaction and delivery speed.
Metrics in agile serve multiple purposes:
- Performance Measurement: Assessing the velocity and efficiency of teams.
- Predictability: Offering insights into future delivery timelines based on historical data.
- Quality Assurance: Monitoring defect rates and ensuring product quality.
- Team Dynamics: Understanding team collaboration and engagement levels.
1.3 Key Agile Metrics
Velocity is one of the most commonly used Agile metrics, particularly in Scrum. It measures the amount of work completed by a team in a given iteration, typically expressed in story points, hours, or other units of work.
To calculate velocity, teams sum the story points of all completed user stories during a sprint. For example:
- Sprint 1: 20 story points completed
- Sprint 2: 25 story points completed
- Sprint 3: 30 story points completedAverage Velocity = (20 + 25 + 30) / 3 = 25 story points/sprint
Consider a software development team that consistently delivers an average of 25 story points per sprint. If they have a backlog of 100 story points, they can estimate that it will take approximately four sprints to complete the backlog. This predictive capability allows stakeholders to plan releases and allocate resources effectively.

- Velocity is a Measure of Productivity: While velocity indicates how much work a team can handle, it should not be used to compare teams or as a sole indicator of productivity.
- Velocity Should Always Increase: Teams may experience fluctuations in velocity due to various factors, including team changes, complexity of work, or external dependencies.
- lead time: The total time taken from the moment a request is made until it is delivered.
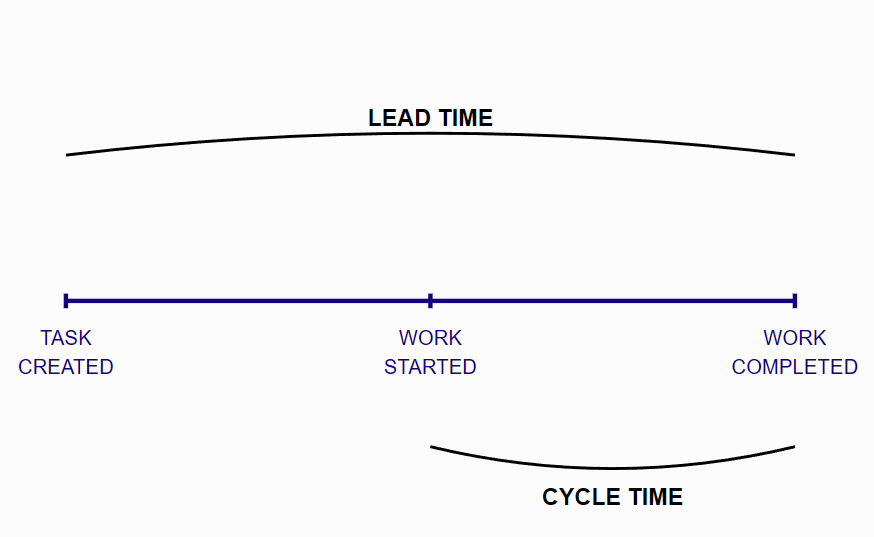
- cycle time: The time taken from when work begins on a request until it is completed.These metrics are crucial for understanding the efficiency of the development process. They help identify bottlenecks and areas for improvement.
- Lead Time: If a user story is created on January 1st and delivered on January 10th, the lead time is 10 days.

Lead Time Scatter Plot with Percentiles:
- Shows 30 data points representing lead times for different work items.
- The 50th percentile (median) is shown as a green dashed line.
- The 95th percentile is shown as a red dashed line.
- This chart helps visualize the distribution of lead times and identify outliers.
- Cycle Time: If work on the same user story begins on January 5th and is completed on January 10th, the cycle time is 5 days.By analyzing lead and cycle times, teams can identify delays and streamline processes. For instance, if lead times are consistently long, it may indicate issues in requirements gathering or stakeholder engagement.
Both charts visually represent work completed versus work remaining over time, providing a clear view of progress throughout a sprint or project.
- Burndown Chart: Displays the remaining work in a sprint, allowing teams to visualize their progress towards completing all tasks.


- Burnup Chart: Shows the amount of work completed over time, highlighting scope changes.These charts help teams assess their pace and make necessary adjustments. For example, if the burndown chart shows a flat line, it may indicate that the team is not making progress, prompting a review of the workflow or team dynamics.

-
A CFD is a visual representation of the different stages of work items in a project over time. It shows the number of work items in each state (e. g. , To Do, in progress, Done) and helps teams identify bottlenecks and inefficiencies in their workflow.
- Flat Lines: Indicate stages where work items are getting stuck.
- Increasing Areas: Show how many items are being completed over time.
- Visual Clarity: Provides a clear overview of work item status.
- Bottleneck Identification: Helps teams identify stages where work is accumulating.
1.4 Best Practices for Implementing Agile Metrics
When selecting metrics, prioritize those that provide insights into outcomes, such as customer satisfaction and product quality, rather than merely measuring outputs like hours worked or lines of code.
Choose metrics that are easy for all team members to understand and use. Complicated metrics can lead to confusion and misinterpretation.
Metrics should evolve as the team and project progress. Regularly review the effectiveness of the metrics being used and adjust as necessary.
Encourage open communication about metrics and their implications. Transparency helps build trust within the team and promotes a culture of continuous improvement.
Metrics should be used to identify areas for growth rather than as a means of penalizing team members. This mindset fosters a more collaborative and supportive environment.
1.5 Challenges and Misconceptions
Misinterpretation of metrics can lead to misguided decisions. It’s crucial to understand the context behind the numbers.
Focusing excessively on metrics can detract from the Agile principles of collaboration and customer satisfaction. Balance is key.
Teams may resist new metrics or processes. Educating team members on the benefits of metrics can help ease this transition.
Not all metrics are suitable for every team or project. Tailor metrics to align with team goals and project requirements.
1.6 Starting out
When organizations begin their Agile journey, the initial approach to measuring metrics often starts with manual processes. Teams typically collect data through spreadsheets, physical boards, or basic project management tools, requiring significant effort to gather, compile, and analyze information. This manual stage, while time-consuming, is crucial as it helps teams understand which metrics are truly valuable and how to interpret them effectively. As teams mature and processes stabilize, there’s a natural progression towards automation. Organizations start leveraging more sophisticated tools that can automatically capture data points, utilize APIs to integrate different systems, and generate real-time dashboards. This evolution not only saves time but also enables more accurate, consistent, and timely reporting. The shift to automation allows teams to focus more on analyzing trends and making data-driven decisions rather than spending time on data collection, ultimately leading to more responsive and efficient Agile practices.
Here are some examples of
- Predictive Analytics: Leveraging data analytics to forecast project outcomes and improve decision-making.
- Real-Time Metrics: Utilizing tools and platforms that provide real-time insights into team performance and project status.
- Integration with DevOps: Combining Agile metrics with DevOps practices to enhance collaboration and streamline workflows.
1.7 Conclusion
Agile metrics are vital for measuring the effectiveness of Agile practices and guiding teams toward continuous improvement. By focusing on key metrics such as velocity, lead time, cycle time, and visual tools like burndown charts and cumulative flow diagrams, teams can gain valuable insights into their performance and areas for growth.
As Agile methodologies continue to evolve, the importance of selecting the right metrics and fostering a culture of transparency and improvement will remain pivotal. By understanding and applying Agile metrics effectively, teams can not only enhance their productivity and efficiency but also deliver greater value to their customers.
In the ever-changing landscape of software development, staying informed about the latest trends in Agile metrics will be crucial for teams aiming to maintain a competitive edge. As we move forward, embracing data-driven decision-making will undoubtedly shape the future of Agile practices.
Latest Articles
-
- Understanding a Typical scrum master Job Description Explained – September 21, 2024
- Understand What is Lead Time in Kanban for Better Efficiency – September 21, 2024
- understanding agile Ceremonies: what are They and Why They matter – September 20, 2024
- What is scrumban? A Comprehensive Guide to Agile Project … – September 19, 2024
- Essential Scrum Master Interview Questions You Should Know – September 19, 2024